Is Predictive Policing Preventative?
Overview
As many cities move toward using machine learning in their policing systems, we want to explore how they affect the policed people. Several cities have implemented the use of predictive policing algorithms including New York City, NY and Santa Cruz, CA. The models built for ‘predictive policing’ claim to have reduced crime and increased efficiency in police resources. These claims have led us to investigate the question: “How is predictive policing being used and what is the effect on traffic stops?”.
We will investigate whether PredPol has a causal effect of reducing crime and potential bias in the system. Our study focuses on data from LAPD who has used PredPol since 2013. Our study will determine whether PredPol affects crime and explore which crimes, areas, and people are most affected by the system. Although the results cannot necessarily generalize, the structure of the predictive policing algorithms used is similar: optimizing police resources to deter crime before it happens.
In 2013, the LAPD deployed PredPol in three divisions of the twenty-one Foothill, Southeast, North Hollywood. It was then extended to all divisions in 2015, shown in the map below.
How have crimes and arrests changed?
If PredPol’s claims are accurate, we should be able to see a reduction in crime numbers after it was deployed. However, the animation below tells a different story. Although crime in a few divisions did decrease starting in 2013, once PredPol was deployed in all divisions (2015), crime began to increase again.
 Additionally, arrest numbers in all divisions except for Hollywood and Central gradually decrease. This could be due to PredPol affecting only certain crime types. For example, we wouldn’t expect financial crime (fraud or computer hacking) to be very impacted by a larger police presence. This led us to continue our analysis accounting for different crime types.
The interactive maps below show the statistics from testing how the proportions of each crime type changed in each division after PredPol was deployed. The first map displays the proportion of crimes committed while the second shows the proportion of arrests made for the selected crime type. Comparing the different crime types shows us that PredPol did not affect all crimes equally. There was an overall increase in the proportions of property crimes committed and arrested for while financial crimes and other miscellaneous crimes saw decreases in crime and arrests.
Was there a reduction in pedestrian and vehicle stops?
Since police stops is the most common form of interaction with a police, we also looked at how PredPol may hIn addition to the crime and arrest data, we also looked at how PredPol impacted pedestrian and vehicle stops. This was important since traffic stops are the most common form of interaction between civilians and police. The county-level analysis showed that there was a decrease in the annual number of stops. However, not all divisions saw the same level of decrease. For example, stops in the Hollenbeck division kept on increasing since 2016.
Did PredPol target minority groups?
The traffic stops data also allowed us to see if there were any racial discrepancies in the stops made during PredPol’s deployment compared to before.
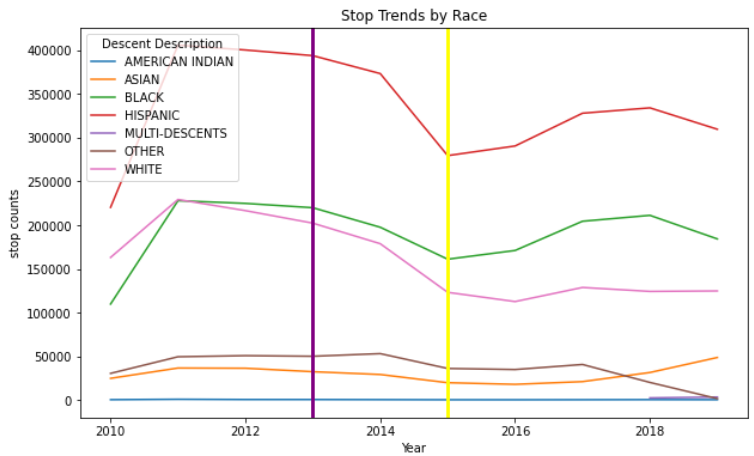
The plot above shows the annual number of stops made per race from 2010 to 2019. For each race, stops decreased during the period when PredPol was first deployed out to just three divisions (2013). However, once it was extended to all divisions in 2015, most races experienced and increased number of stops . Our analysis accounted for the different populations of races by using census data to use stop rate (rather than the total number of stops). Our results indicated that Black drivers and pedestrians had a higher rate of getting stopped from 2013 to 2014 in divisions that had PredPol deployed.
Conclusion
From the provided visuals and numbers above, we see that there were shifts in crime and stop trends since the LAPD began to deploy PredPol. The most notable observation is that crimes overall did not go down, which contradicts PredPol’s claim. Overall, although the increase or decrease in crimes cannot be fully attributed to PredPol, we can at least say that there was no reduction in crimes as PredPol has claimed to do. Here is the link to our study for a more detailed approach and findings.